It’s easy to think of science communication as imparting facts the audience doesn’t have yet. Think of what we do in the classroom. We know that we know things students don’t know yet. Students are responsible for absorbing this material if they want an A in the class. On the other hand, we don’t test voters about their factual knowledge before we let them vote. That’s probably a good thing – several southern states used to deploy impossible voter “literacy” tests as a way to disenfranchise black voters. These tests were banned as part of the landmark 1965 Voting Rights Act, but the conservative Roberts Supreme Court overturned this section of the law. Today, the biggest thing stopping a fact-based pop quiz before people vote may be a political party that likes to make up it’s own facts!
Whenever I read about scientific debates being put in to policy, it feels like I always see people taking the tone that “if only the other side knew the facts, they would join us.” For example, if only people knew how harmful it was to the entire school when a parent avoids vaccinating their kids. If only people knew the risks of climate change. Over at Slate, Dr. Tim Requarth has an excellent article summarizing how this “deficit” model is a poor way to communicate science to the broader public. Providing more knowledge actually tends to backfire in lab experiments. So why does the “fill a deficit in people’s knowledge” style of communication persist?
“The deficit model perfectly explains how a scientist learns science. But the obstacles faced by science communicators are not epistemological but cultural. The skills required are not those of a university lecturer but a rhetorician.”
Maybe it’s because I was trained in the social sciences and not neuroscience, but I don’t fully buy this. I have sent scientific manuscripts off to journals where my peer reviewers and/or the editors have had very different assumptions of what good research should be. Any social scientist who tries to publish for long enough will run in to hostile reviewers. I’ve always tried to avoid being this kind of reviewer and focused on the internal consistency of analysis. However, I have seen reviewers ignore serious methods issues that I caught. I think they hated the framing of an article so much that they didn’t bother to keep reading!
Even when we think of ourselves as scientists, we need to learn something about being a “rhetorician” to overcome hostile peer reviewers. Early on in my career, I assumed reviewers would take statistical results at roughly face value. My first quant manuscript showed that, among other things, prime time presidential press conferences received unusual coverage. One of my initial peer reviewers didn’t buy the result. After all, cable news can broadcast breaking news at 2:30 AM if they need to, so why should the time of day matter at all? I was a bit surprised by this comment. First of all, I wasn’t studying cable news!
Looking back on it, this peer reviewer and I had different assumptions. I had written “late runs” for evening stories and rushed against a tight deadline. I spent one evening with the overnight crew at a local TV station and that’s when I started looking at grad school as a less painful option. I knew that just because reporters have the technical capacity to cover stories at 2:30 AM doesn’t mean they want to sacrifice their entire routine to work the graveyard shift. However, I wrote this earlier draft of my article focusing on how these traditions persist even as technological barriers fade. I never really did a good job explaining why these barriers might persist.
When I first got this review I was outraged. Reviewer #2 had invented incorrect facts to justify a rejection. The next time I sent the paper off, a reviewer was furious I didn’t describe a big post 9/11 spike in how George W. Bush’s press conferences were covered. I tested for it and it wasn’t there, after controlling for specific things Bush did differently than his predecessors.
Eventually I learned that even my quantitative articles have to have more storytelling. I can’t just point to the evening press conference variable and rely on common sense. I had to explain that it took Congressional Democrats six years (and a major scandal) to realize they might get a better chance to respond to Ronald Reagan’s prime time press conferences if they stayed in their office to answer a reporter’s phone call! I had to explain what Bush did differently in his press conferences, and that presidents doing things could influence journalists. If my narrative has gaps, people will fill in the gaps with their own assumptions, even though those assumptions are normally wrong.
Assumptions About How the Public Views Science
With this in mind, I wanted to delve in to some assumptions we may have about how the public views science. Donald Trump wants to slash the EPA’s budget. Lamar Smith, the Texas Republican chairman of the House Science committee, insists that scientists are manipulating data to over-emphasize the effects of climate change. His has a long history of using subpoenas to go after federal scientists publishing results he doesn’t like. He also just happens to get more campaign contributions from the oil and gas industry than any other industry. Smith wants all federal grant recipients to pledge they are acting in “the national interest” and accused climate scientists of abandoning the scientific method during a recent hearing. If Lamar Smith is the Republican Party’s main legislator on science and the environment, how much is he speaking for the interests of Republican voters?
To try and answer this question, I looked at data from the American National Election Survey. The full survey asked the same panelists a series of questions before and after the election. One of the things they asked respondents to do was answer, on a 0-100 scale, how do you feel about the following people or groups. 0 is feeling very cold, 50 is average or indifferent, and 100 is warmth. One of the groups they asked about was scientists. Let’s see how they compare to other groups:
|
Overall |
Trump vote |
Other vote |
| Scientists |
76.7 |
71.71 |
81.93 |
| Clinton |
43.81 |
12.99 |
68.88 |
| Trump |
42.09 |
76.29 |
15.65 |
| Christian Fundamentalists |
50.27 |
62 |
39.73 |
| Tea Party |
44.53 |
59.46 |
30.9 |
| Gays & Lesbians |
60.73 |
49.66 |
71.57 |
| Police |
75.48 |
85.33 |
70.38 |
On average, respondents felt more warmth towards scientists than any other person or group in the post-election survey! There is a bit of a partisan split, but warmth towards scientists is fairly bipartisan. At the time of this survey, scientists were not seen as a distinctly liberal interest group. One of the long-standing concerns about today’s March For Science is that marchers would play in to the hands of someone like Lamar Smith, making scientists a more partisan football.
The best analogy may be how people feel about police. Some progressives have strong negative feelings towards police officers, particularly in the wake of Black Lives Matter. However, most Democrats feel at least some warmth to police. Some Trump voters have strong negative feelings towards scientists. However, most Trump voters felt at least some warmth to scientists. The regression results were dull enough (statistical significance but small effects) that I put them as a footnote only.
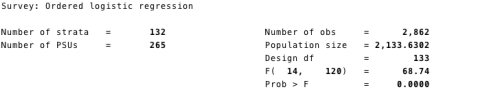
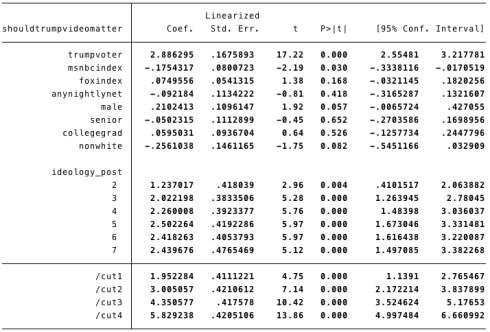
Next, let’s take a look at government funding for “science and technology.” In the abstract, this polls very well in the ANES. 58.35 percent of respondents said the government should spend more money on science and technology. Only 7.52 percent of respondents say the government should spend less money. When people critique spending, they tend to say they dislike particular projects, not the abstract idea. Even Lamar Smith wrote an op-ed in USA Today suggesting more funding in science and technology would be good, even though he spent most of the op-ed attacking scientists he dislikes.
To test where people stand on this issue I ran an ordered logit model. The ologit is used when we have three or more categories that we can put in a rank order, like spend less on science and technology, spend the same amount, or spend more. It assumes each independent variable will have a certain effect pushing people to one end of the spectrum or the other. In other words, having a college degree would either push people to spending more or spending less. It wouldn’t split respondents like a wishbone.
I put this together fairly quickly, so I used the following independent variables:
- College graduate
- Age (range 18-90)
- Male
- Race (white = omitted; multi-racial respondents are coded as “other” in the quick ANES aggregation)
- Trump voter
- Ideology on 7 point liberal/conservative scale, where 1 is very liberal. I use results from the post-election survey.
- A question on how respondents interpret the Bible. All respondents got this question regardless of their faith.
- The Bible is the actual word of God and is to be taken literally, word for word
- The Bible is the word of God but not everything in it should be taken literally
- The Bible is a book written by men and is not the word of God.
- Sometimes I just separated the more secular response from the other two.
- Income is currently restricted in the ANES because it could be used to identify respondents. The survey used two different questions in a split-panel designed for self-identified class, which I don’t want to tangle with today. So there’s no good control there.
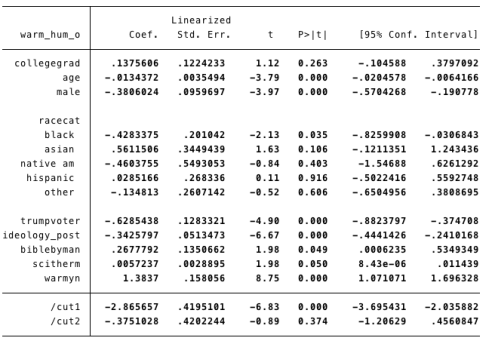
Here are the results:
* Note: Categories are ranked less spending, equal spending, more spending. Positive coefficients indicate a group of respondents who wants the government to spend more.
As we might expect, increased government spending is a partisan issue. The more conservative someone is, the less they support additional government spending on science and technology. Even after controlling for ideology, Trump voters are somewhat less supportive, but p = 0.056. Interpret that however you see fit; I’m going to just move on. College graduates were not significantly more likely to support additional government funding for science. However, people who said the Bible is not the word of God were significantly more in favor of increased government funding.
I’m a bit uneasy about how to interpret the large difference between Hispanic respondents and non-Hispanic Whites. The ANES asked respondents about Hispanic ethnicity and race as separate questions. If I read the codebook correctly, at least 20 percent of Hispanic respondents checked other: Hispanic for race instead of checking a box for white, black, native American, Asian or pacific islander.
Anyway, it’s a bit difficult to interpret ologit results since we need to rely on the cut points to get more tangible estimates of how many respondents are in each category. I used Stata’s margins command to make two different predictions. First, here is the prediction for White males who voted for Trump, lack a college degree, and did not say the Bible is written by men:
| Ideology |
Less Funding |
Equal Funding |
More Funding |
| 1 (very liberal) |
5.26% |
27.06% |
67.68% |
| 2 |
6.20% |
30.05% |
63.75% |
| 3 |
7.30% |
33.08% |
59.62% |
| 4 |
8.58% |
36.07% |
55.35% |
| 5 |
10.05% |
38.95% |
51.00% |
| 6 |
11.74% |
41.62% |
46.64% |
| 7 (very conservative) |
13.68% |
44.00% |
42.32% |
Now here are White females who did not vote for Trump, have a college degree, and said the Bible is written by men:
| Ideology |
Less Funding |
Equal Funding |
More Funding |
| 1 (very liberal) |
2.69% |
16.52% |
80.79% |
| 2 |
3.19% |
18.88% |
77.94% |
| 3 |
3.77% |
21.45% |
74.78% |
| 4 |
4.46% |
24.19% |
71.35% |
| 5 |
5.27% |
27.09% |
67.64% |
| 6 |
6.21% |
30.08% |
63.70% |
| 7 (very conservative) |
7.31% |
33.11% |
59.57% |
There are definitely some differences based on political ideology and other variables. However, more funding for science and technology has pretty strong support in the abstract.
If people marching today talk about scientific method or process in abstract terms, they should remember that this has fairly broad support. Even conservative Trump voters have relatively warm feelings towards scientists and funding science. Marchers can build off these positive associations. It’s worth noting that even Lamar Smith is trying to draft off the positive associations people have with science. He’s trying to portray himself as a defender of “good science” even as he conducts political witch hunts. (I’ve seen progressives use similar framing to attack conservative scholarship, but they lack subpoena power.)
If marchers accuse Republican voters of being broadly anti-science, they risk alienating voters and making scientists look like a liberal interest group. Right now, most Republican voters do not associate science with liberal interest groups. They may associate a few disciplines with liberal interest groups. I think most sociologists want to strengthen that association. But portraying all Republicans as being anti-science could easily backfire, since this is not how many Republicans see themselves.
Science In the Abstract vs. Environmental Policy
The elephant in the room is that partisans tend to see specific science-related policy choices differently than they see science in the abstract. For example, Lamar Smith can write an op-ed declaring his support for more science funding, then spend most of his time in Congress attacking climate researchers. Voters could feel warmly towards scientists, but still resist vaccination. Prior studies have shown that conservatives with a high amount of scientific knowledge know what the scientific consensus is on climate change, but they refuse to accept it. We may be better off thinking of hostile audiences outside academic like we think of hostile peer reviewers, instead of treating them like people who just need to be informed about science.
With that in mind, I decided to test how much having a college degree and warm feelings towards scientists affect respondents’ views on climate change, after controlling for ideology. For now let’s start with the question “is global warming happening?” 80.8 percent of respondents said global warming has probably been happening, while 19.2 percent said it probably hasn’t been happening. Those were the only options in the ANES. Respondents couldn’t choose a definitive yes or no. Given how pessimistic some of my friends are, I expected to see more “it’s probably not happening” responses. I ran a logit regression to see what predicts a yes. (I know, it’s weird when most people say yes, but I think this makes the direction of coefficients easier to keep straight.)
Reminder: positive regression coefficients here mean support for the more environmentalist position that global warming is probably happening.
For starters, it’s worth pointing out that college graduates were not significantly more likely to say global warming is probably happening. One of the biggest surprises here is that there isn’t a straight line between how literally someone takes the Bible and whether they think global warming is happening. People who took a moderate stance on this question of faith were the most likely to say global warming is probably happening, controlling for other variables. It’s easy to think of rational, atheistic science on one side of environmental debates and evangelical faith as the other side. It may be worth thinking more about how to talk to people who are in the middle, trying to balance the warnings of modern science with the teachings of their religious faith.
As we might expect, political ideology is the biggest predictor of whether someone says global warming is probably happening. Even after controlling for some variables that predict political ideology and whether someone voted for Trump, political identity and behavior appear to have a strong correlation with someone’s belief in whether global warming is a real phenomenon. (Full disclosure: this is a bit of a statistical dodge in the causal argument since “do you think global warming is happening?” came from the pre-election wave of the ANES.) Here are predicted probabilities for saying global warming is real, based on who someone voted for and their political ideologies:
| Ideology |
Trump Voter |
Other Voter |
| 1 (very liberal) |
91.34% |
97.46% |
| 2 |
87.96% |
96.35% |
| 3 |
83.52% |
94.78% |
| 4 |
77.91% |
92.62% |
| 5 |
71.09% |
89.66% |
| 6 |
63.20% |
85.74% |
| 7 (very conservative) |
54.56% |
80.68% |
What Causes Global Warming?
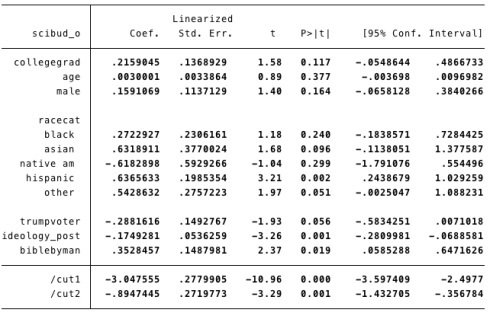
Finally, let’s take a look at the follow-up question: “do you think a rise in the world’s temperatures would be caused mostly by human activity, natural causes, or about equally human activity and natural causes?” People who had said they don’t believe the earth is warming were asked to assume it is for this follow-up question. (They were overwhelmingly willing to give an answer instead of refusing to answer.) 38.8 percent said mostly human activity, 18.2 percent said mostly natural causes, and 43 percent said the two were roughly equal.
I re-ordered the responses for an ordered logit model. In this model, positive regression coefficients mean a respondent moves closer to saying climate change is mostly caused by human activity.
There is a whole lot to talk about here. Let’s start with the biggest coefficient. People who said global warming is probably happening were much more likely to say human activity is causing global warming. It may seem so obvious that these go together that treating one variable as a cause and the other as an effect is a bit weird. Normally I would agree. However, these questions come one after the other. This gives us a good transition to talk about how to persuade people. Scholars tend to agree that it’s hard to change someone’s mind once they are dead set on an issue. It’s easier to get someone to form new associations about an issue than directly countering their position. It’s even easier to prompt people by reminding them of something they know. Most people know the Earth is getting warmer. Reminding them of this may make it easier to associate certain human activity with rising temperatures.
Most of the other variables operate like we’d expect. Older respondents, males and African Americans were all closer to the “mostly natural causes” side. People who gave the secular answer “the Bible was written by men” were a bit more likely to say humans are also responsible for climate change. However, college graduates were not significantly more likely to say this, after controlling for other variables. Respondents’ feelings of warmth towards scientists barely made a dent in what they thought about climate change.
In many ways, positions on climate change appear to be a way that respondents express their political identity. I think this actually makes a lot of sense. Let’s assume we all want to secure freedom, prosperity and happiness for ourselves and our children. That’s a really big goal. It’s also a really hard goal. How do we get there? If the world provided one clear answer that stood head and shoulders above the rest, we’d all flock to it. However, human behavior is far too complex and unpredictable. When people have broad goals and don’t really know how to achieve them, they tend to adopt various rituals.
Moving away from fossil fuels could have a major impact on people’s day-to-day lives. Large sections of America take commuting by car for granted. Cutting back on cars could mean massive changes in when people work and how much time we can spend with loved ones. Some people would lose jobs. Others would find better jobs. Cutting back on things like air conditioning could have a serious impact on Americans’ quality of life. Of course, so could rising oceans and unpredictable freakish weather.
When I look at these results, I can’t help but wonder if people say the climate is not changing or human activity doesn’t cause climate change because they are terrified of having to change their daily routines. I can sympathize with that. Change is hard. All of us who have had to make some change in our personal or professional lives know how hard change can be. It’s not surprising that people who don’t want to change their behavior on the environment would flock towards conservatism, particularly the nostalgic sloganeering of “Make America Great Again.”
I understand why people get so angry at climate change deniers, but I can’t quite tap in to that anger myself. The stakes are too high. If talking to people about their fears gets them to understand how anxiety leads to poor decisions, that’s better for the environment than any yelling or screaming we are capable of.